
You’ve created a website for your product, your project, your company. Congratulations!
What does it do for you on a daily basis? Does it bring you prospects, leads, customers, sales? Do you regularly measure its usefulness to your business?
You don’t know exactly?
Today, we’d like to tell you a little more about the Google Analytics tool, what indicators to track and how to interpret them.
First of all, the main aim of web analytics is to understand your visitors’ online behavior and evaluate your website’s performance.
Web analytics allows you to :
- draw conclusions to improve your visitors’ user experience,
- optimize your business objectives
- make informed decisions based on concrete data.
So why should you use Google Analytics?
Google Analytics is all about knowing :
- How do users find your website or application?
- How do they interact with your website or application and draw conclusions to improve their user experience.
- What content is most useful for achieving company objectives?
- How effective are your campaigns, and assess whether your actions are helping you achieve your business objectives.
In short, it’s all about making informed decisions based on concrete data!
1- Measuring performance indicators :
Key performance indicators (KPIs) must be defined in line with your company’s objectives.
These KPIs can include the number of unique visitors, time spent on the site, conversions, sales, conversion rate, etc…
When your customers interact with the content of your site or application, these interactions are sent to Google Analytics in the form of events. Many common interactions are automatically collected as events in Google Analytics. For example, when a user visits your site or application for the first time, Google Analytics records this action as a first visit or opening event.
Similarly, when a user clicks on an outbound link to leave your site, GA records this action as an outbound link click event.
As events are collected, they are processed and transformed into information that you can view in reports. You can then analyze this data to obtain specific information.

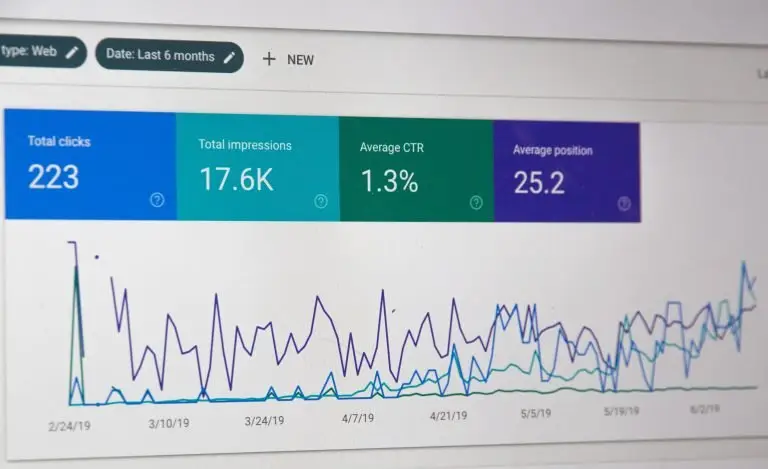
2- How the dashboard looks
You will find 4 main sections:
- Home: You’ll first arrive at Home, where you’ll find information relevant to you and your property. Maps become increasingly personalized as you use Google Analytics.
- Reports: Go to Reports to view ready-to-use reports that answer common questions about how your users interact with your application or website.
- Explore: Go to Explore to use advanced analysis techniques that go beyond standard reports to help you uncover deeper insights into your customers’ engagement.
- Advertising: Go to Advertising to analyze, understand and improve your online advertising efforts.
There are 2 default report types:
- Lifecycle: containing reports on acquisition, on-site behavior and monetization;
- User: containing reports on technology and demographic information.
Note that you may have different default report collections depending on the information you provided during setup, but you can always add these default reports later using the customization function.
There’s potentially an enormous amount of data to analyze in the various categories available! Google Analytics offers a multitude of indicators for tracking and analyzing website performance. To find out which indicators to track, go back to your business objectives.
Convinced, but don’t have the time?
Let’s take a look at the 7 main indicators available to you.
1- Bounce Rate
This is the percentage of visitors who leave the site after viewing a single page. A high rate may indicate a lack of content relevance or a navigation problem. An analysis of the pages concerned will help identify areas for improvement.
Bounce rate may vary depending on the type of website and its purpose, but in general :
- Normal bounce rate: between 26% and 40% is considered excellent.
- Average bounce rate: between 41% and 55%, which is common for most sites.
- High bounce rate: above 56%, especially if it exceeds 70%, may be a warning sign.
However, interpretation depends on context :
- Content sites or blogs: A high bounce rate (50% to 70%) is often normal, as visitors can find the information they’re looking for on a single page before leaving.
- E-commerce sites: A high bounce rate (over 50%) may indicate problems, such as a poor user experience, pages that are too slow to load, or unattractive content.
- Single-page sites (landing pages): Here, high bounce rates (70% or more) can be normal, especially if the page directly fulfills its objective, such as a registration or a click to another platform.
- The actions to be implemented are :
- Improve the relevance of content to visitors’ keyword searches.
- Optimize design and page loading speed.
- Add clear calls to action (CTAs) to encourage users to navigate the site further.
- Provide relevant internal links to keep visitors engaged.
2- Average Session
This is the average time spent by users on your site. If the average time is equal to 1 min 20 s, users spend relatively little time on your site, which may indicate a lack of interest or relevance of content, confusing navigation, or misaligned expectations with your visitors.
- The actions to be considered are :
- Create more detailed, engaging content, such as blog posts, videos or infographics.
- Integrate videos or interactive elements to capture visitors’ attention.
- Analyze the pages where users spend the least time, to identify areas for improvement.
3- Conversion Rate
It corresponds to the percentage of visitors who complete an important action such as a purchase, registration or download. If your conversions are low despite high traffic, it’s essential to review your landing pages, user path and offers.
A conversion rate of 2% means that only 2 out of every 100 visitors complete a desired action (purchase, registration, download). Here are a few benchmarks based on your industry and site type :
- E-commerce: A high-performance conversion rate is generally between 2% and 5%. Highly optimized sites sometimes reach 8% or more, especially in specific niches or with advanced personalization strategies.
- B2B sites (lead generation): Average conversion rates oscillate between 3% and 5% for forms or registrations, although rates in excess of 10% are achievable with clear targeting and value proposition.
- Landing pages (specific pages for campaigns): A good conversion rate can vary between 10% and 20%, depending on the quality of the traffic and the relevance of the offer. Some optimized pages even achieve 25% or more.
- SaaS (subscriptions or free trials): Conversion rates for free trials vary between 5% and 10%, while the transition from trial to paid subscription is often lower, around 1% to 5%..
To increase the conversion rate, it is necessary to :
- Check industry-specific benchmarks to evaluate your performance.
- Simplify the conversion process (for example, reduce the number of steps in a purchase tunnel).
- Add testimonials, guarantees or calls to action on critical pages.
- A/B test different page variants to identify those that convert best.
4- Returning Visitors
These are the visitors who return to your site after a first visit. For example, if this rate is 20%, few visitors are coming back, which may indicate a lack of loyalty.
In this case, you can:
- Set up a newsletter to maintain regular contact with users.
- Propose exclusive offers or regularly updated content.
- Create a loyalty program or community around the site.
5- Acquisition Channels
The origin of traffic can be multiple: Organic Search (traffic from search engines), Direct (users accessing the site directly, e.g. by typing in the URL), Referral (traffic from other sites), Social (visitors from social networks), Campaigns (traffic generated by advertising campaigns or newsletters). An unbalanced distribution or dependence on a single source could lead you to diversify your marketing efforts.
In concrete terms, if you see the following figures:
- Organic search engine optimization (SEO): 40% of sales
- Social networking: 10% of sales
- Direct traffic: 30%
- Paid advertising: 20% of sales
In this case, social networks have little impact compared to other channels. You might consider :
- Increase your presence on social networks by regularly publishing engaging content.
- Include calls to action in your social media posts
6- Your site's Page Load Time
An average loading time of 1.5 seconds or more can be considered high, resulting in a loss of visitors. In the majority of cases, it’s photo or video content, or the use of resource-hungry computer languages (such as Java) that make your site heavy.
The various possible actions to remedy this are :
- Compress images and use a CDN (Content Delivery Network).
- Always use an external tool such as Youtube or Vimeo to host your videos.
- Optimize code and enable caching.
- Migrate to higher-performance hosting if necessary.
7- Top Pages
If one product page on your site receives 50% of total traffic, that page is a key asset. However, it also shows that the other pages aren’t attracting enough attention.
The following actions can be considered :
- Highlight this page in marketing campaigns.
- Reinforce calls to action on this page to maximize conversions.
- Make other pages more visible via backlinks or promotional campaigns.
These analyses and actions are part of an iterative approach. The aim is to observe the impact of each optimization on overall performance, and to continue adjusting strategies.
By monitoring these indicators on a regular basis, you will gain a clear view of your site’s performance and be able to make informed decisions to ensure that your website is truly serving your business.
Need help matching your business objectives with the right KPIs?